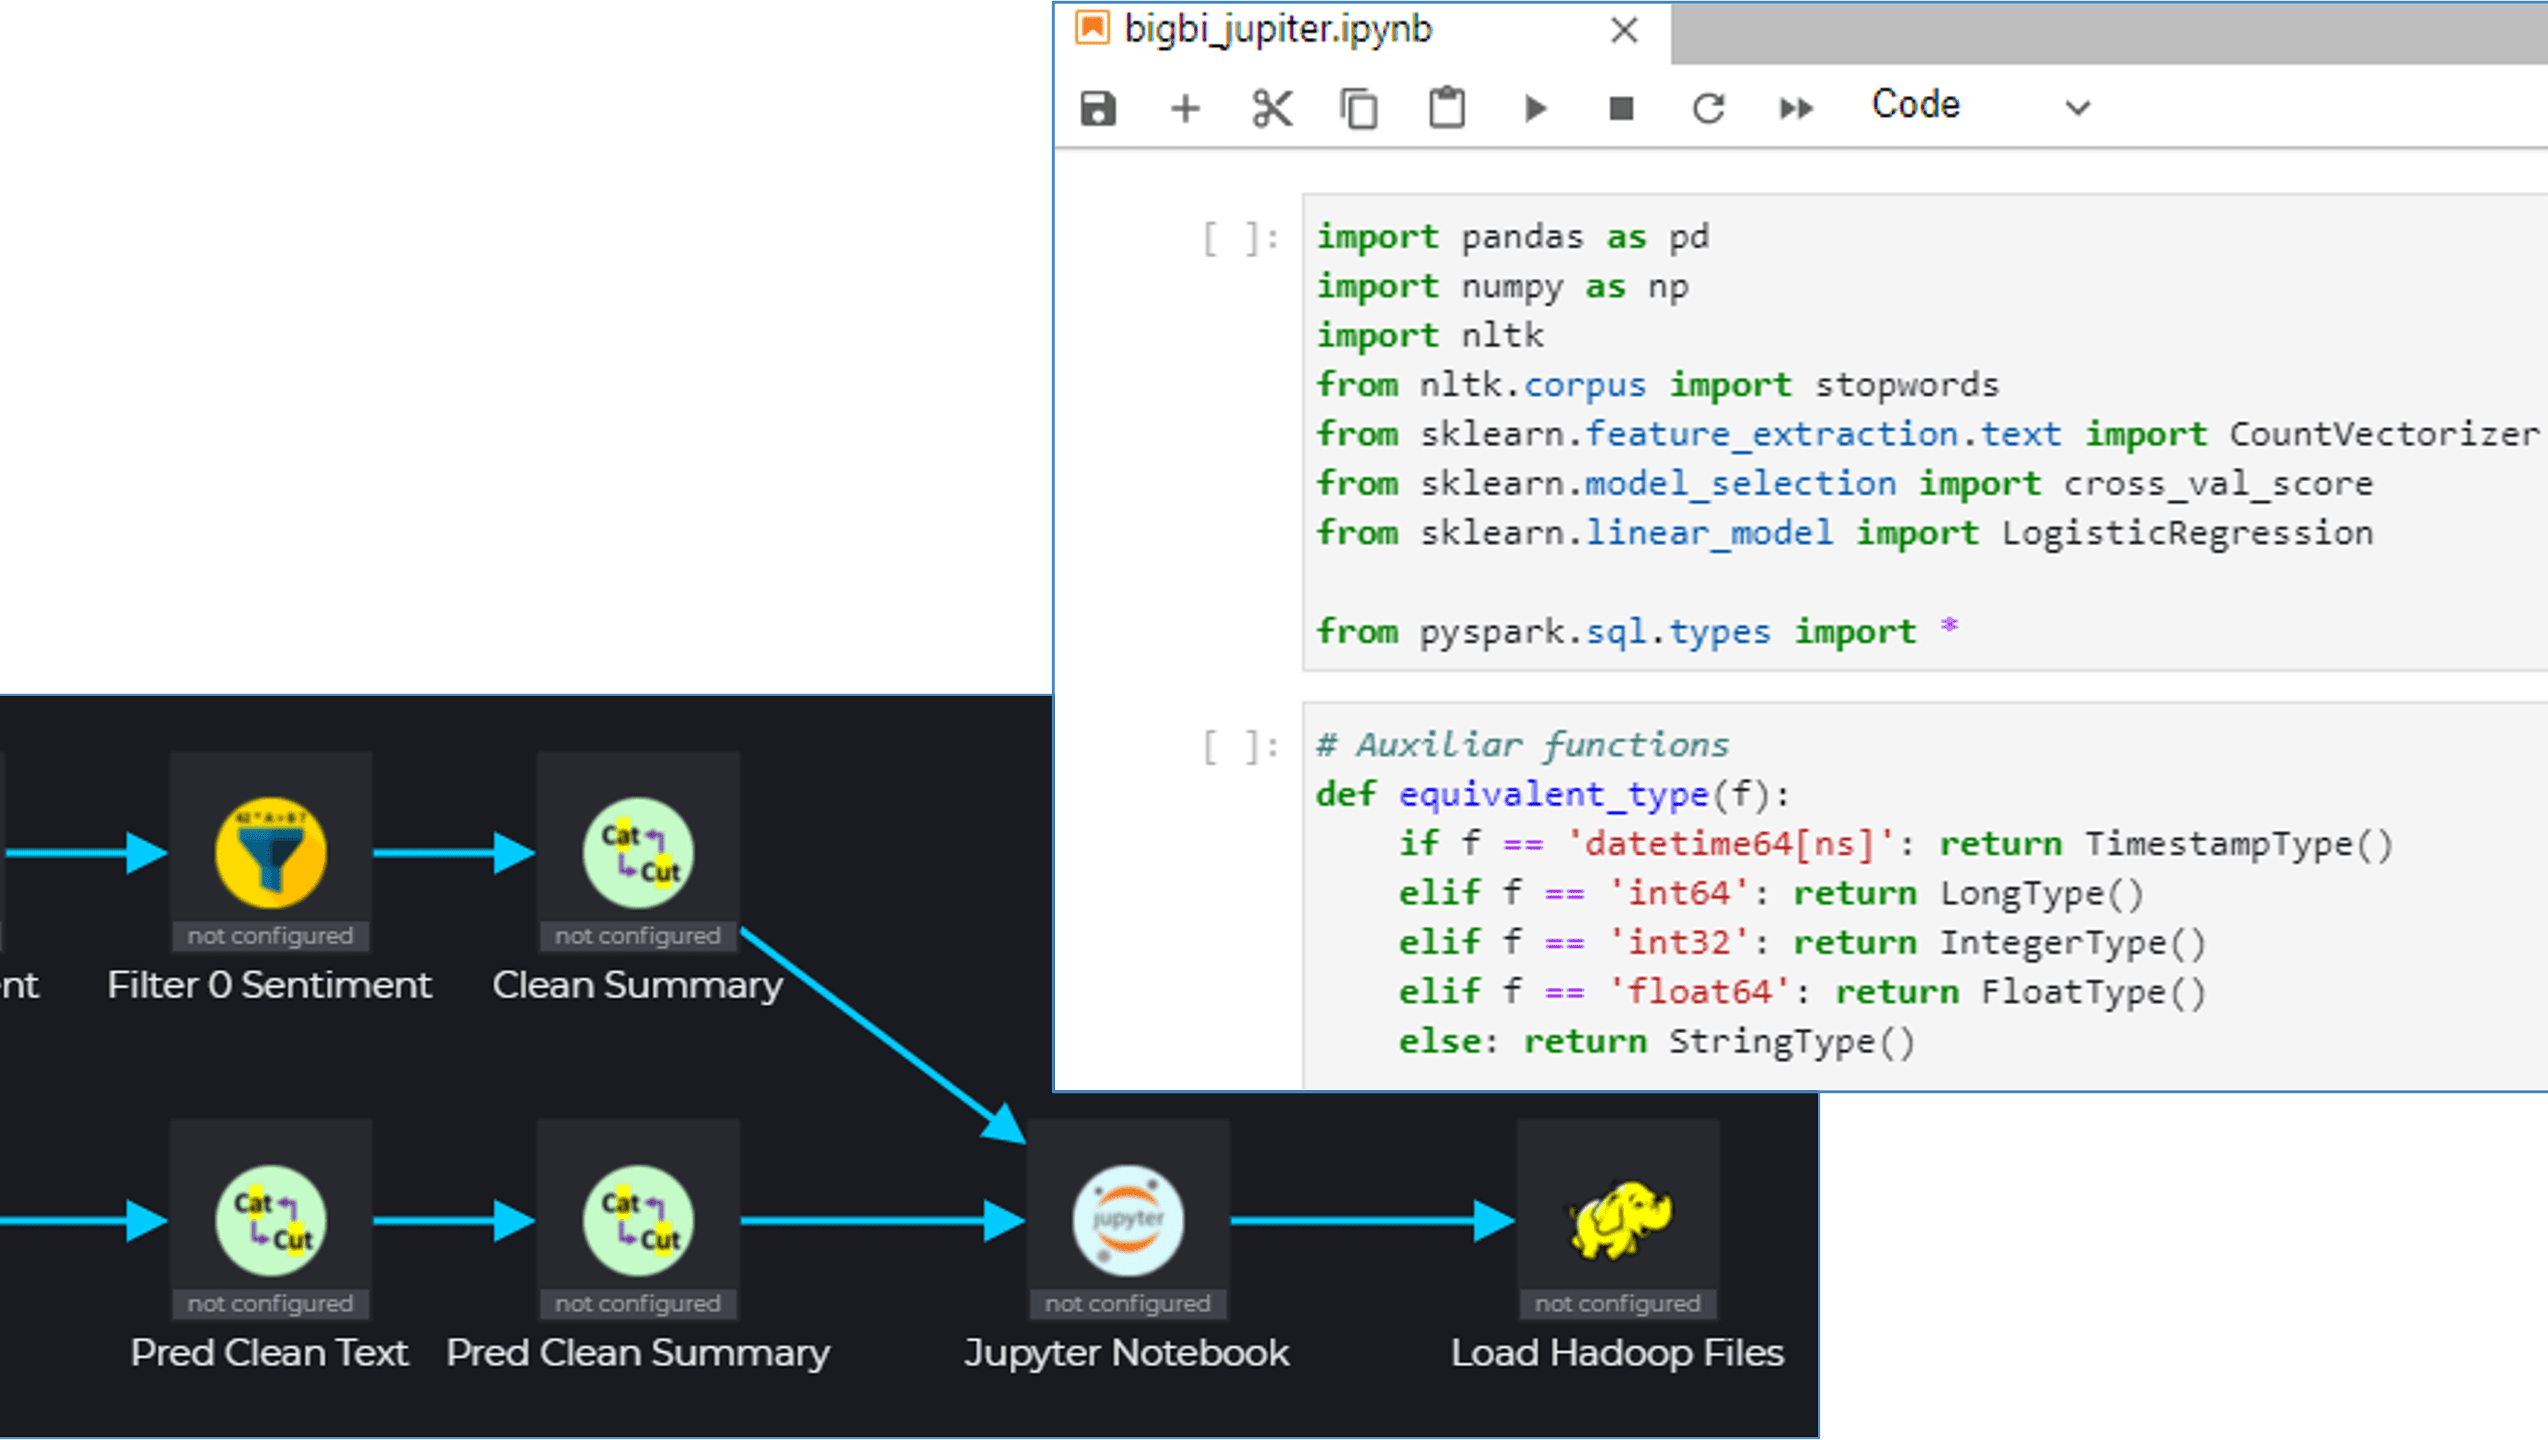
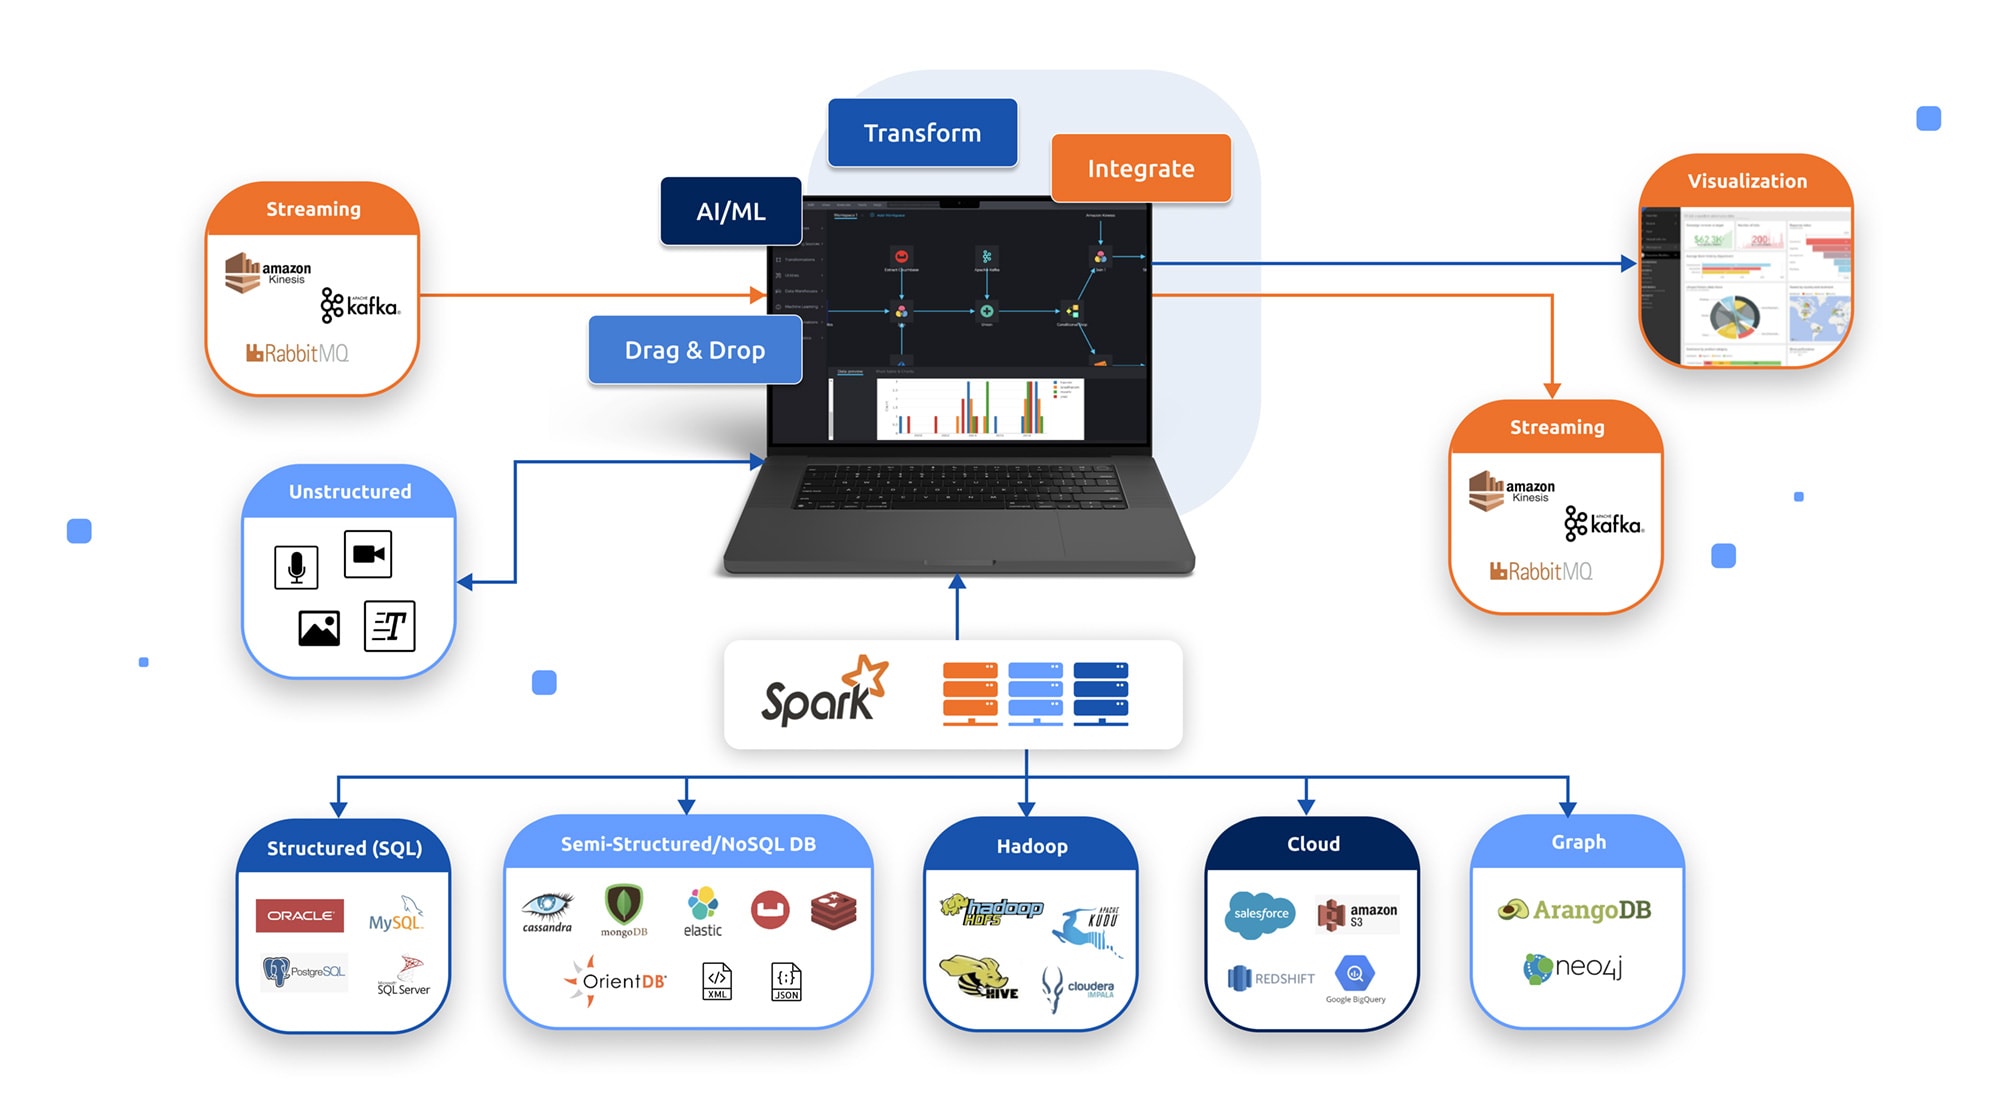
BigBI’s studio visual ETL has been natively built for the Apache Spark platform, meaning any visual operation on BigBI studio would be performed, interactively on the Spark cluster.
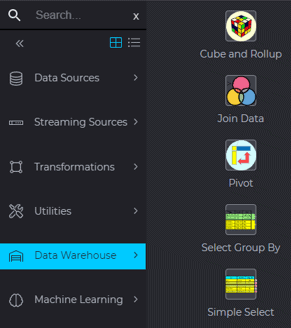
Pipelines are built with a simple drag & drop operations and set by easy-to-use wizards.
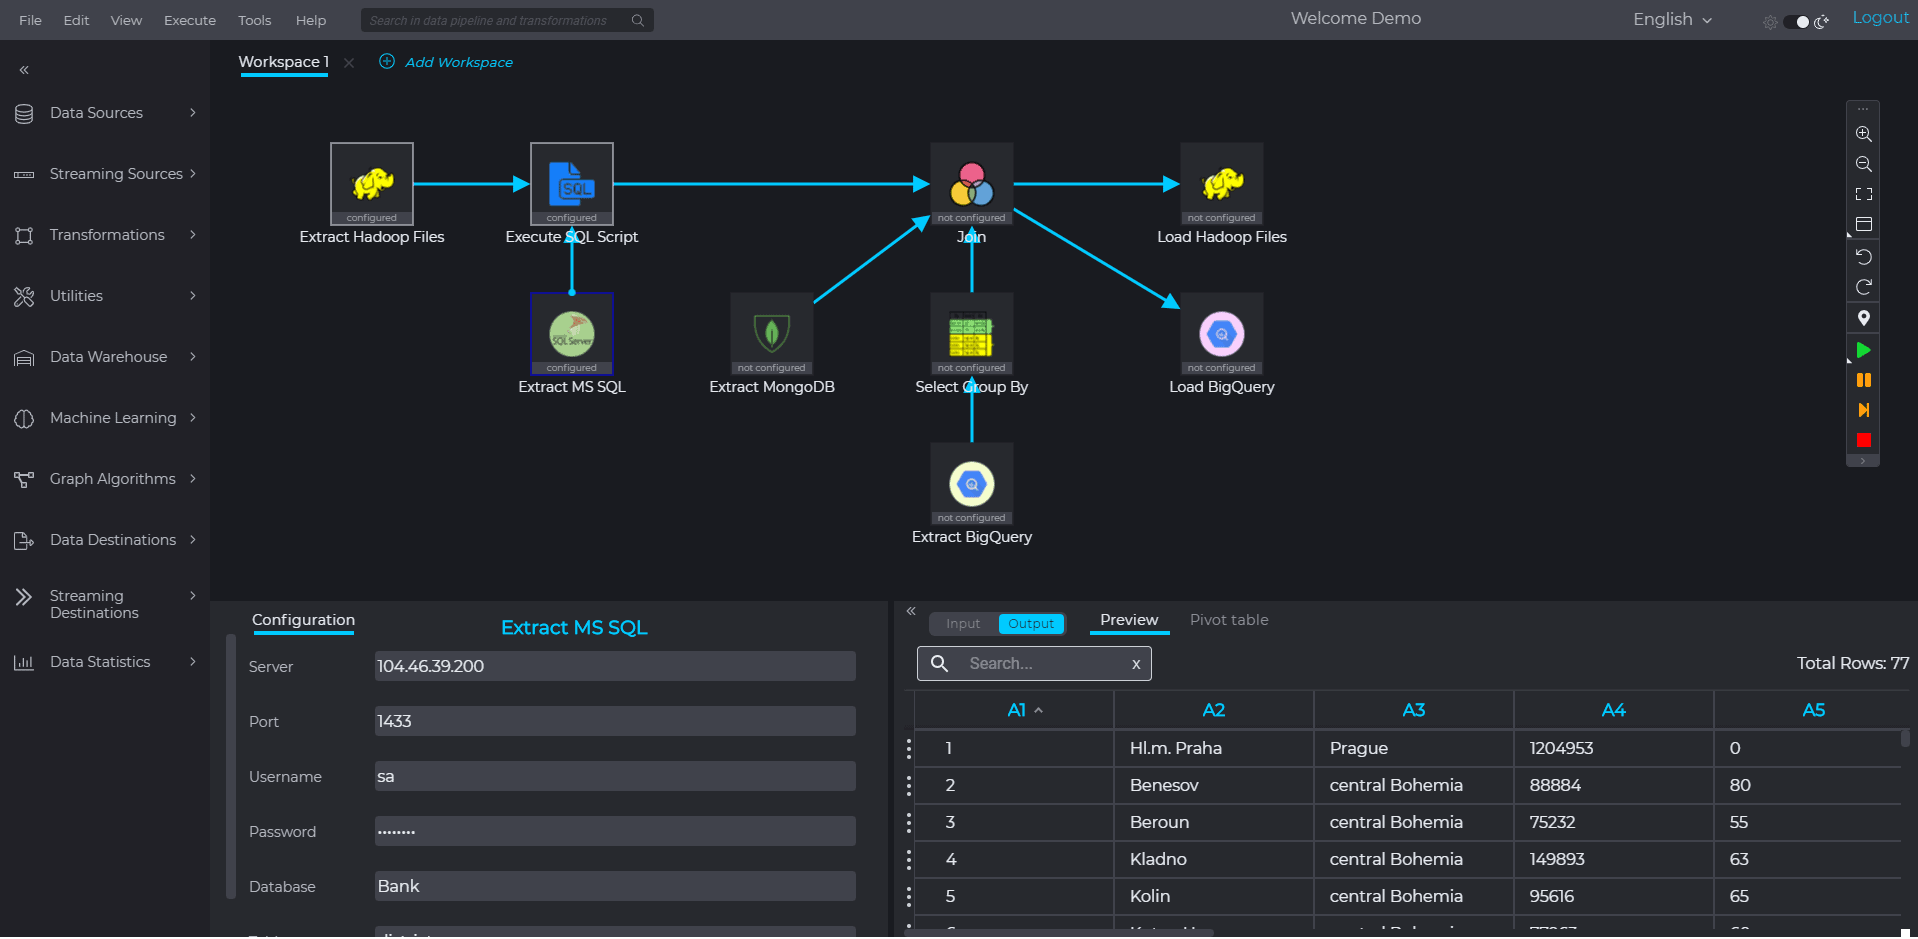
All data sources, transformations & data destinations are placed on canvas and connected to the adjacent steps by drag & click.
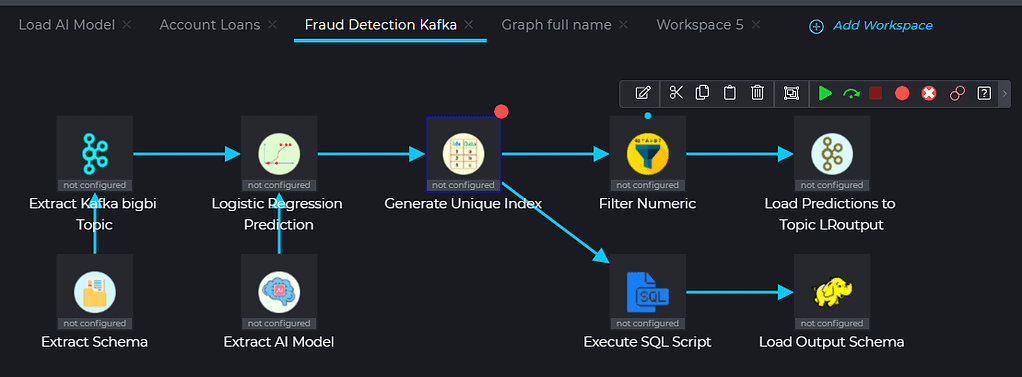
Additionally all data sources, transformations and data destinations could be easily configured by easy-to use data wizards. The green success message shows successful configuration and execution, while orange error messages explains what needs to be corrected.
 Define by wizard
Examine data samples per step
While building the Big data pipeline, the user can see data samples from the various data sources and how such data samples would look like after execution of each step in the data pipeline- in real time from the Spark cluster. This interactive examination of the sample processing expediates the pipeline development process, reduces errors, and strengthens the confidence at the actual results of such pipeline – saving time and effort in pipeline development.
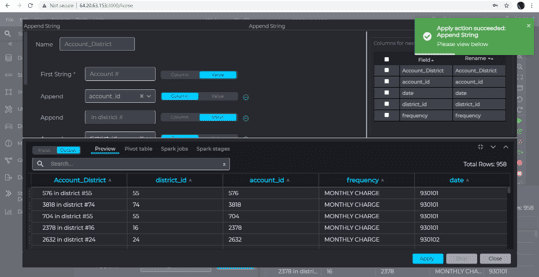
Interim results could be examined both in a textual form as well as graph visualization. A pivot graph function enables the analyst to examine different relationships between data fields (directly from the Spark cluster) to get comfortable with the results.
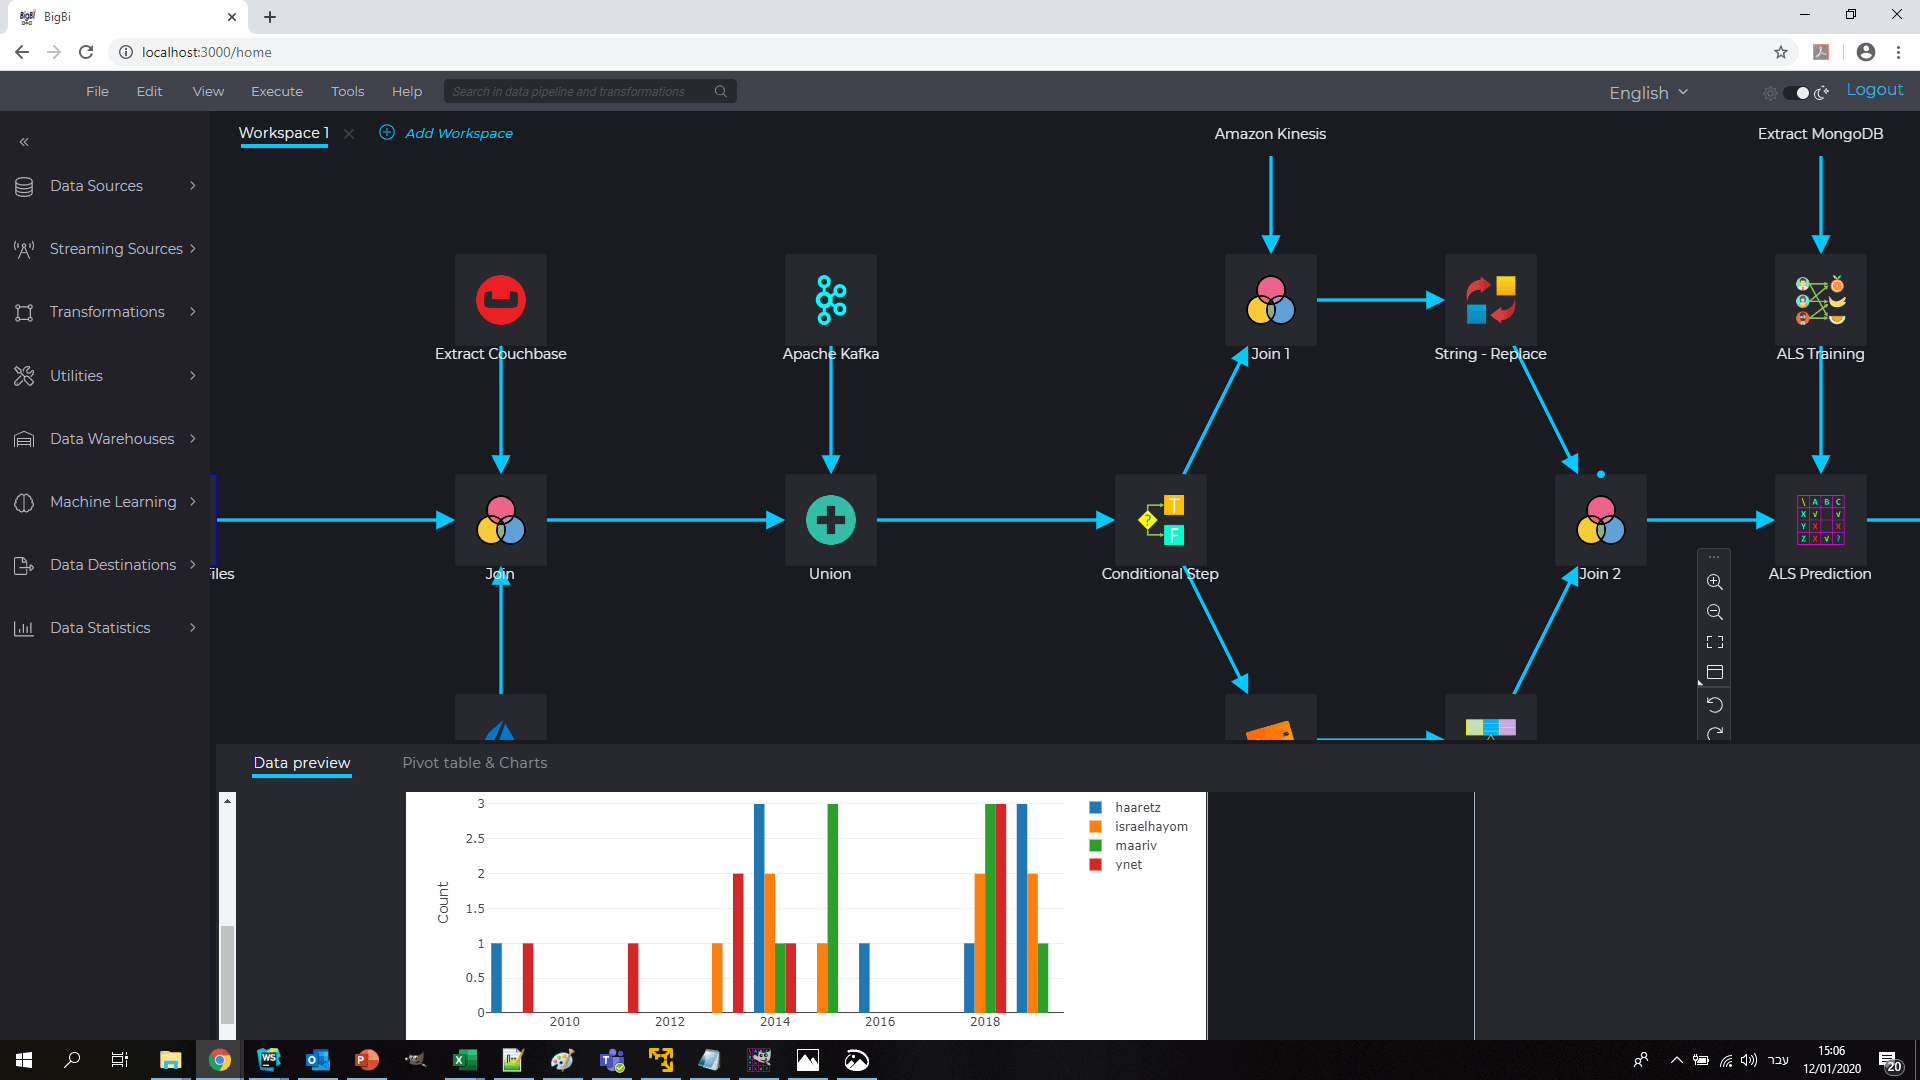
Visualizing & pivoting interim results
Interactive debugging toolbar enables the running of the developed pipeline on the full data set (not just samples) and viewing both final & interim results.
Breakpoint (red dots) could be set along the pipeline to stop the pipeline running for examination of interim results, than resume running, etc.
The user can monitor the advancement and health of the relevant Spark jobs (light blue) in real time.
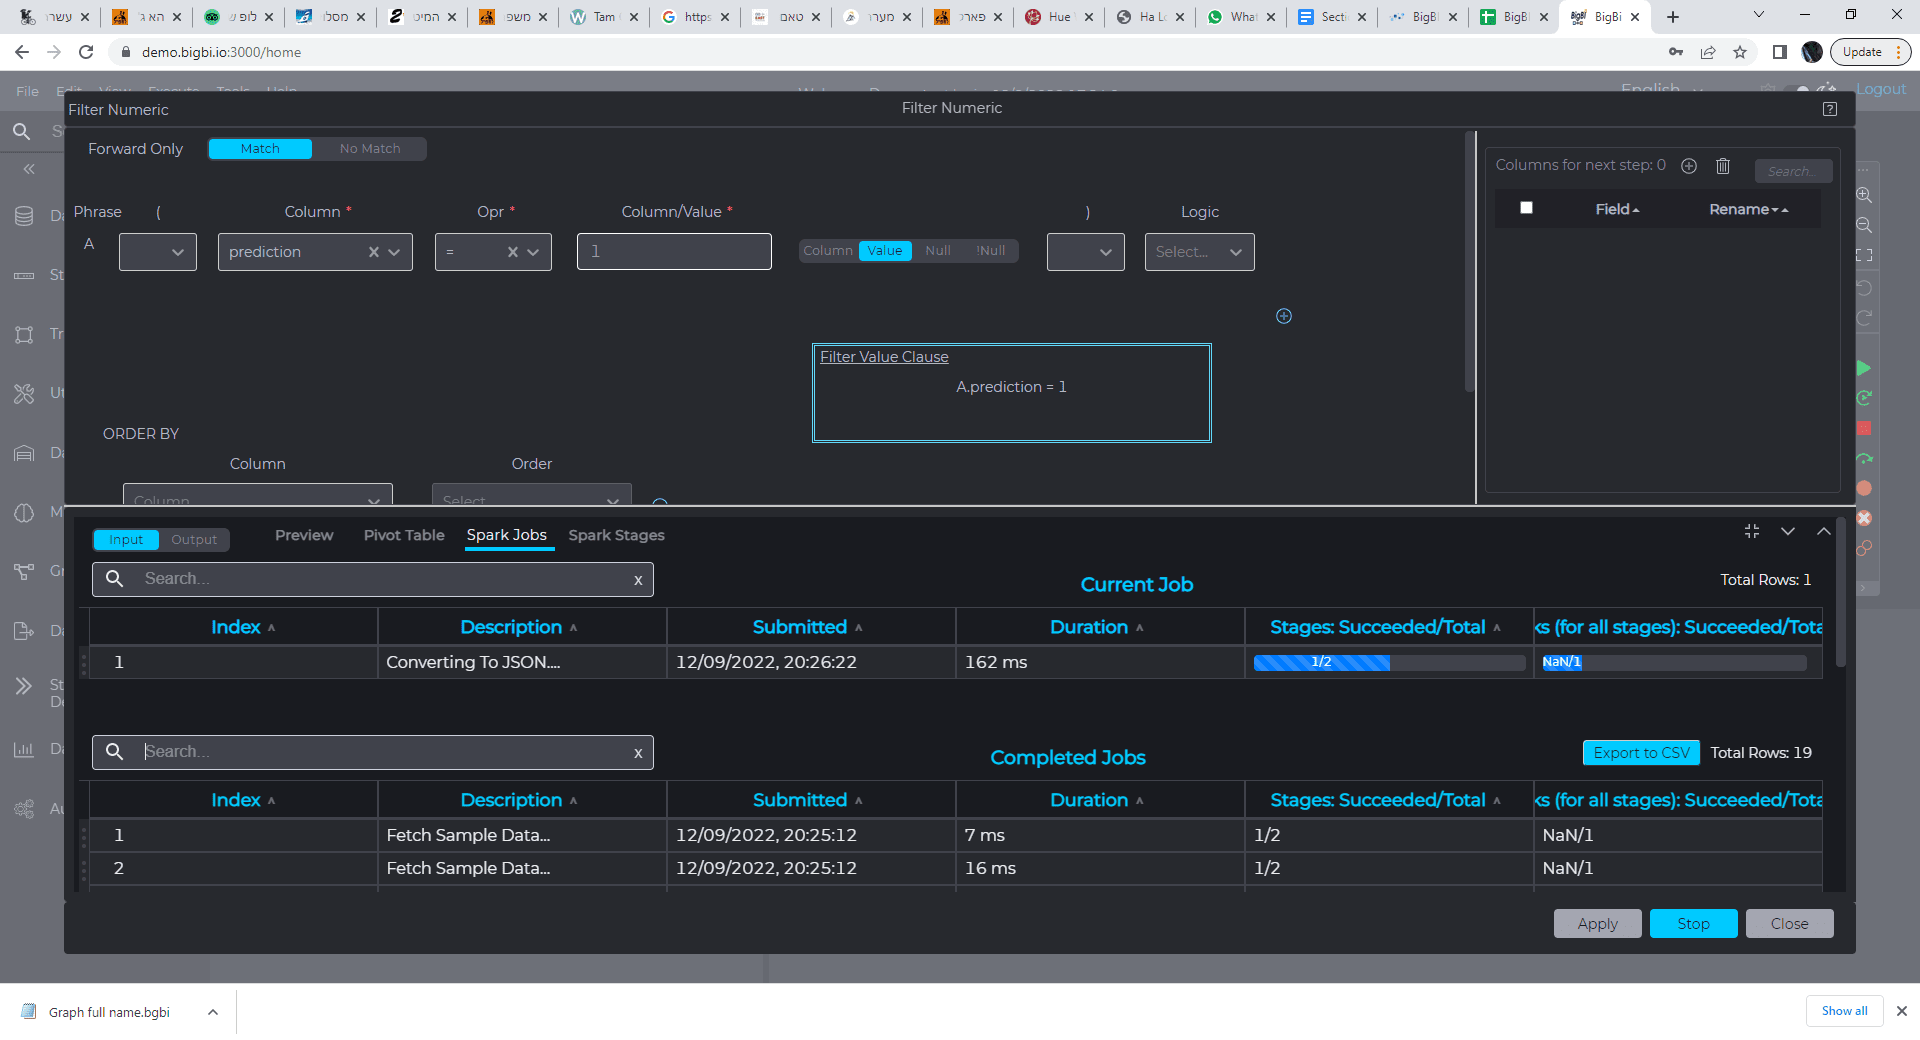 Monitoring Spark jobs & performance
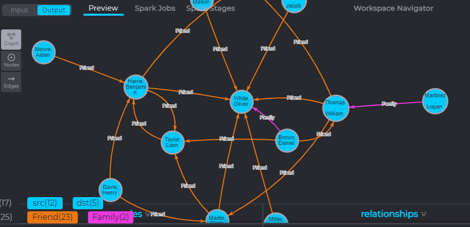
Graph & Graph algorithms are strong paradigm for link analysis which is being used in many vertical applications such as social influence analysis, fraud investigation, cyber security, homeland security, transportation or resource allocation & optimization.
BigBI implements Apache Spark GraphX to build, analyze & visualize Graph data paradigm.
Graphs can be built as part of the data pipeline as an intersection of 2 tables (nodes & edges), and analyzed with a rich set of graph algorithms (for example, shortest path or page rank). The Graph could be later saved into any of the supported persistent data repository formats for future inquiry or dismantled to data sets.
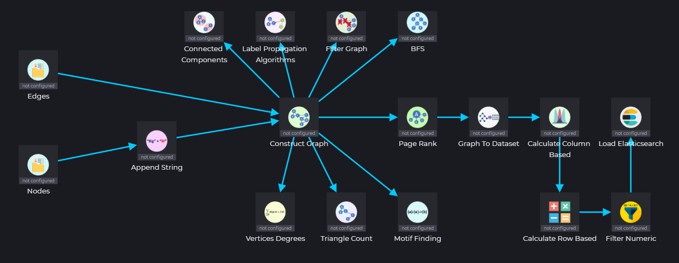
Building and analyzing a graph as a part of the data pipeline
The graph calculated attributes (such as the page rank of an entity- measuring its relative influence in the graph) could later be attached to specific data entities as enrichment and further analyzed by the data pipe logic including machine learning algorithms.